Charts als kollektives Psychogramm
Wie der X‑Algorithmus Retail‑Communities von The Long Investor bis ins DACH‑Sentiment treibt.
Warum die Linien auf dem Bildschirm seltener den Markt zeigen, als wir glauben — und öfter den Schwarm, der ihn beobachtet. Eine Bestandsaufnahme zwischen Behavioral Finance, Patreon‑Ökonomie und einem Algorithmus, dessen Innenleben seit Anfang 2026 als Rust‑Code auf GitHub liegt.
Am 27. Januar 2021 verzeichnete das Subreddit r/wallstreetbets an einem einzigen Tag rund 73 Millionen Seitenaufrufe. GameStop schloss bei 347,51 US‑Dollar. Drei Jahre später, am 13. Mai 2024, genügten ein Meme‑Bild auf X und der reaktivierte Account von Keith Gill, um den Kurs binnen Stunden um über 50 Prozent zu hebeln. Zwischen diesen beiden Tagen liegt keine neue Theorie der Märkte. Es liegt eine neue Infrastruktur dazwischen — Patreon‑Abos in vier‑ und fünfstelliger Mitgliederzahl, Discord‑Server mit Live‑Chart‑Sessions, ein zwischen 2023 und 2026 mehrfach umgeschriebener Empfehlungsalgorithmus, der heute fast jede Nuance jedes finanzbezogenen Posts „liest", bevor er entscheidet, wem er ihn zeigt.
Dieser Artikel versucht, drei Dinge zusammenzudenken, die in der deutschsprachigen Finanzpresse meist getrennt verhandelt werden: die alte Theorie, dass technische Chart‑Analyse vor allem ein Spiegel der Massenpsychologie ist; die neuen, nicht‑organisierten Retail‑Communities auf Patreon, Discord und Telegram, von denen The Long Investor mit über 11.000 zahlenden Mitgliedern eine der größten weltweit ist; und der Verstärker, der sie verbindet — der X‑Algorithmus, dessen Engagement‑Gewichte seit März 2023 öffentlich einsehbar sind und seit Januar 2026 in einer Grok‑basierten Neufassung vorliegen.
Die These ist nicht neu, aber sie verdient eine empirische Überprüfung: Technische Analyse funktioniert nicht trotz, sondern weil sie Erwartungen koordiniert — und der X‑Algorithmus liefert die schnellste Koordinationsmaschine, die Privatanleger je hatten. Das ist Chance und Risiko in einem.
1. Charts als kollektives Psychogramm
1.1 Dow, Hamilton, Rhea — die ältesten Spiegel
Charles Dow hat nie ein Buch über die nach ihm benannte Theorie geschrieben. Sein Erbe sind 255 Leitartikel im Wall Street Journal zwischen 1899 und 1902. Sein Nachfolger William Peter Hamilton goss die Beobachtungen 1922 in The Stock Market Barometer, Robert Rhea kodifizierte sie 1932 in The Dow Theory in jene drei Sätze, die bis heute jeder Trader auswendig kann: Trends bewegen sich in drei Größenordnungen, Märkte durchlaufen drei Phasen, Indizes müssen einander bestätigen.
Was die wenigsten wissen: Hamiltons Track Record ist akademisch geprüft worden. Brown, Goetzmann und Kumar replizierten 1998 im Journal of Finance seine WSJ‑Calls mit einem neuronalen Netz und fanden risikoadjustierte Überrenditen. Das ist eine der wenigen Studien, die einer technischen Methode eine empirische Berechtigung attestiert — und ausgerechnet sie betrifft eine 100 Jahre alte Methode.
Edwards & Magees Technical Analysis of Stock Trends, seit 1948 in mittlerweile elfter Auflage, ist das andere Fundament. Beide Werke teilen eine Annahme, die Dow eher implizit machte: Der Markt ist ein Diskontierungsmechanismus für die psychischen Zustände seiner Teilnehmer. Wenn das stimmt, ist ein Chart kein Bild des Unternehmens. Es ist ein Bild der Menschen, die das Unternehmen handeln.
1.2 Herd Behavior und Informationskaskaden
Die formale Theorie dafür ist erst später nachgeliefert worden. Abhijit Banerjee, später Wirtschaftsnobelpreisträger, beschrieb 1992 in „A Simple Model of Herd Behavior" rationale Akteure, die ihre eigenen Signale ignorieren, sobald sie sehen, was andere tun. Zeitgleich entwickelten Bikhchandani, Hirshleifer und Welch die Theorie der „informational cascades": Sobald genug Marktteilnehmer in dieselbe Richtung handeln, wird es individuell rational, mitzulaufen — selbst gegen das eigene Wissen.
Robert Shiller hatte das bereits 1984 in Brookings Papers on Economic Activity mit „Stock Prices and Social Dynamics" empirisch unterfüttert: Preise bewegen sich weiter, als Fundamentaldaten je rechtfertigen würden. Sein späteres Irrational Exuberance (2000) wurde wenige Monate vor dem Dotcom‑Crash veröffentlicht — selten hat ein Buch sein Timing besser gewählt.
Wer technische Analyse betreibt, betreibt im Grunde Cascade‑Reading: Man sucht den Moment, in dem die Menge kippt. Charles Kindleberger und Robert Aliber haben diese Logik in Manias, Panics, and Crashes historisch durchdekliniert, von der Tulpenmanie bis zur Subprime‑Krise.
1.3 Fear & Greed — Sentiment, das man kaufen und verkaufen kann
Der CNN Fear & Greed Index, 2012 von CNNMoney lanciert, ist heute der bekannteste Sentiment‑Indikator überhaupt. Sieben Komponenten — Marktmomentum, 52‑Wochen‑Hochs/Tiefs, McClellan Volume Summation, Put/Call‑Ratio, VIX, Safe‑Haven‑Demand, Junk‑Bond‑Demand — werden zu einer Zahl zwischen 0 und 100 verrechnet.
Akademisch validiert ist der Index nicht. Er ist ein journalistisches Kompositum, kein peer‑reviewter Indikator. Wer sauber arbeiten will, greift zu Da, Engelberg & Gao (2015), die mit Google‑Suchanfragen einen ähnlichen „FEARS"‑Proxy konstruieren — mit nachweisbarer Prognosekraft im Review of Financial Studies. Aber als Sprache der Community ist Fear & Greed unschlagbar. Wenn der Index unter 25 fällt, schreibt halb FinTwit „Extreme Fear", und das ist dann auch wieder Information.
1.4 Self‑Fulfilling Prophecy — funktioniert TA, weil wir alle daran glauben?
Die methodisch sauberste Antwort auf die Frage, ob technische Analyse „funktioniert", stammt von Andrew Lo, Harry Mamaysky und Jiang Wang (2000): Mit Kernel‑Regression detektierten sie zehn klassische Muster — Kopf‑Schulter, Doppeltop, etc. — auf US‑Aktien von 1962 bis 1996. Mehrere Muster trugen statistisch signifikante Zusatzinformation. Das war die akademische Teilrehabilitation des Chartismus.
Park und Irwin (2007) zogen im Journal of Economic Surveys die Meta‑Bilanz aus 95 modernen Studien: 56 positiv, 20 negativ, 19 gemischt. Die Profitabilität von TA‑Regeln nimmt im Zeitverlauf ab — konsistent mit Lo's späterer Adaptive Markets Hypothesis (2004): Strategien funktionieren, werden adaptiert, werden wegarbitriert, tauchen anderswo wieder auf.
Entscheidend für unsere Frage: Lukas Menkhoff zeigte 2010 in einer Studie über 692 Fondsmanager in fünf Ländern, dass 87 Prozent technische Analyse zumindest mit Gewicht nutzen — besonders auf kurzen Zeithorizonten und im FX‑Markt. Die selbst‑erfüllende Prophezeiung ist also keine Spekulation. Wenn fast alle Profis dieselben Linien zeichnen, werden diese Linien zu Schelling‑Punkten — Koordinationspunkten, an denen sich Orderbücher häufen.
Und genau das ist der Mechanismus, an dem die folgenden Kapitel andocken: Communities zeichnen kollektiv dieselben Linien, der Algorithmus verstärkt die Sichtbarkeit, die Cluster reagieren — und der Chart bekommt im Nachhinein recht.
2. Nicht‑organisierte Retail‑Communities: Das neue Zentrum
2.1 The Long Investor — Anatomie einer Patreon‑Maschine
Wer den Namen The Long Investor das erste Mal auf X liest, hält ihn für einen kleinen Account unter vielen. Tatsächlich gehört das Projekt zu den drei größten Finanz‑Patreons der Welt. Laut Graphtreon — der seit Jahren etablierten Tracking‑Plattform für Patreon‑Daten — hat The Long Investor aktuell rund 11.187 zahlende Mitglieder und etwa 24.290 Follower insgesamt; Platz 68 im Patreon‑Gesamtranking, Platz zwei bis drei in der Finance‑Kategorie. Gestartet ist der Account am 11. November 2022. In dreieinhalb Jahren hat das Projekt eine Größe erreicht, für die deutsche Vermögensverwalter Jahrzehnte brauchen.
Die Mechanik ist methodisch hybrid: Elliott‑Wellen‑Analyse als technisches Rückgrat, kombiniert mit fundamentalen Deep Dives, einem wöchentlichen „LIT Sunday News"‑Newsletter, einer regelmäßig aktualisierten Top‑10‑ und Top‑20‑Liste, plus rund 15 annotierten Charts pro Tag. Drei Zeithorizonte (0–1, 1–5, 5+ Jahre), klare Investment‑Regeln („Don't Day Trade", „Never use Options", „Never use Leverage") und eine Premium‑Tier Executive Lounge für rund 447,50 Euro pro Monat mit privater Telegram‑Gruppe und persönlichen Buy/Sell‑Alerts.
Über den Gründer ist öffentlich wenig bekannt — er tritt anonym auf. Er beschreibt sich selbst als Airline‑Captain mit B.A. in International Business & Economics und 17 Jahren Erfahrung in der Finanzindustrie. Nachprüfbar ist davon nichts. Die Trustpilot‑Seite, die unter ähnlichem Namen kursiert, betrifft ein anderes Unternehmen (longinvest.biz) und ist nicht der Patreon‑Account. Bei einer Geschäftseinheit, die nach konservativer Schätzung im hohen sechsstelligen Bereich pro Monat umsetzt, ist die Anonymität ein Punkt, den jeder Abonnent für sich abwägen muss.
Als ich die täglichen Charts über mehrere Monate hinweg beobachtet habe, war der Eindruck zwiespältig. Die handwerkliche Qualität der Elliott‑Annotationen ist hoch, die Linienführung diszipliniert, der Stil ruhig — der Account verkauft keine Hysterie. Gleichzeitig ist Elliott‑Wave als Methode notorisch flexibel: Ein Zählmuster, das gestern „Wave 4" hieß, kann morgen „extended Wave 2" sein, ohne dass es einer empirischen Falsifikation begegnet. Genau diese Flexibilität ist Teil des Geschäftsmodells. Sie hält die Community im Gespräch.
2.2 Die DACH‑Landschaft jenseits von „finX"
Hier ist eine sachliche Anmerkung nötig: Der Name „finX" wird im DACH‑Raum oft als Sammelbegriff für deutschsprachige Finance‑Communities verwendet, eine eigenständige große Patreon‑ oder Discord‑Plattform unter exakt diesem Namen lässt sich aber nicht zweifelsfrei verifizieren. Was unter „finX" firmiert, ist meist FINX Global (ein Crypto‑/Web3‑Infrastruktur‑Projekt), der Global X FinTech ETF (Ticker FINX) oder der Studentenverein Finnex an der Nordakademie — alle drei sind keine deutschsprachigen Retail‑Trading‑Communities.
Die tatsächlichen Pendants zu The Long Investor im DACH‑Raum sehen anders aus, und es lohnt sich, sie sauber zu sortieren:
YouTube, Discord, Instagram
~2,58 Mio. YouTube, 600K+ Instagram, ~37–64K Discord
ETF‑Sparplan, breite Bildung
~375.000
Passiv, ETF, dogmatisch
~120.000
DAX‑YOLO‑Memes, Optionsscheine
Discord + Premium
~12.500 Discord
TA + FA, Hidden Champions
Discord + Kurse
aktiv
Day Trading, Chart‑Schulung
seit 2015
News‑Daytrading DAX/Forex
~500K+ Reichweite
Frauen, Finanzbildung
Die Skalen sind nicht direkt vergleichbar. Während The Long Investor etwa 11.000 zahlende Mitglieder hat, sind die meisten DACH‑Größen kostenlose Reichweiten‑Player mit deutlich kleineren Premium‑Tiers. Der Schweizer Sparkojote (Thomas Kovacs) etwa hat unter 1.500 Discord‑Mitglieder, generiert seine Reichweite primär über YouTube und Podcast.
Die wichtigste strukturelle Beobachtung: Die DACH‑Szene ist weniger Chart‑zentriert als die US‑Szene. r/Finanzen ist gegenüber technischer Analyse offen feindselig, r/mauerstrassenwetten nutzt sie semi‑ironisch, Wir Lieben Aktien und Chartsekte sind die wenigen prominenten Communities mit echter TA‑Substanz. Die Treiber des deutschen Aktienbooms — laut Deutsches Aktieninstitut 14,1 Millionen Aktionäre 2025 — sind nicht Chart‑Communities, sondern ETF‑Sparpläne und Finanzfluss‑Tutorials.
2.3 USA vs. DACH — zwei Investitionskulturen
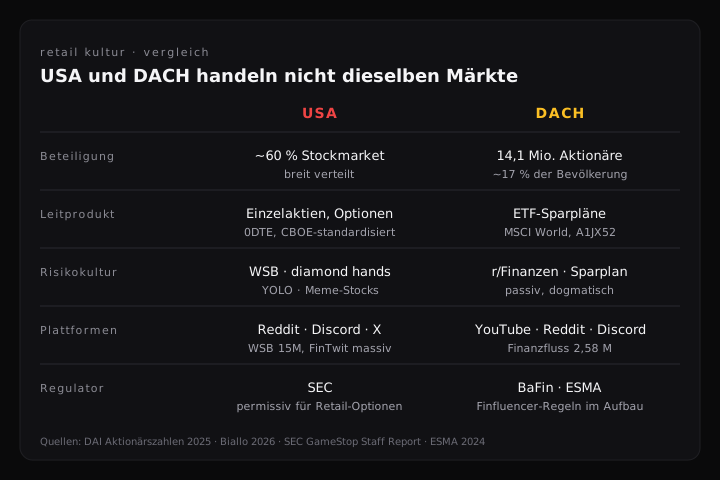
Ich finde den Vergleich interessant, weil er erklärt, warum ein Phänomen wie The Long Investor (englischsprachig, US/Irland‑Standort, Elliott‑Wave‑Methodik, knapp 261.000 X‑Follower) in der deutschsprachigen Diskussion praktisch nicht existiert. Die US‑Retail‑Kultur ist optionsfokussiert, derivatelastig, in Patreon‑/Discord‑Premium‑Strukturen organisiert. Die DACH‑Kultur ist Sparplan‑getrieben, ETF‑zentriert, in YouTube‑Bildungsformaten zuhause. Wer Charts diskutiert, tut das eher auf TradingView (in der deutschen Sektion Handelsideen) als in einer geschlossenen Bezahlcommunity.
Diese Asymmetrie ist nicht reine Mentalität. Sie ist eine Folge der Produktlandschaft: In den USA handeln Privatanleger an der CBOE standardisierte Optionen mit transparenten Preisstrukturen, in Deutschland dominieren Optionsscheine — bankemittierte OTC‑Produkte, deren Preisbildung sich Außenstehenden weniger erschließt. Hinzu kommt die Regulierung, auf die wir im Kapitel 6 zurückkommen.
3. Der X‑Algorithmus als Beschleuniger
3.1 Was die GitHub‑Veröffentlichungen verraten
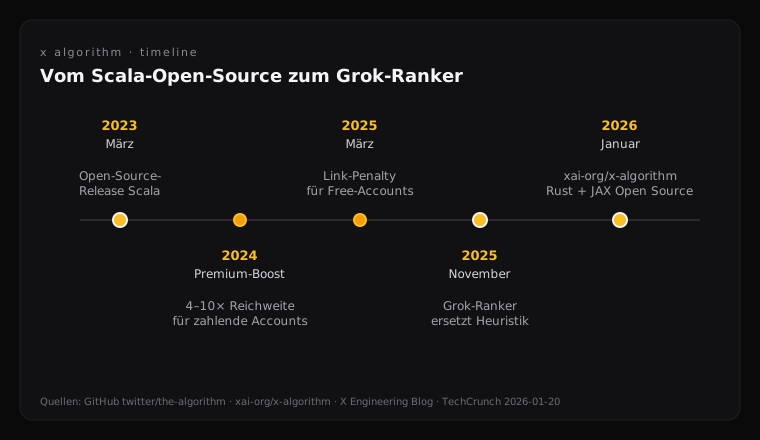
Am 31. März 2023 veröffentlichte das damalige Twitter‑Engineering‑Team unter twitter/the-algorithm (Scala, heute ~73.000 GitHub‑Stars) und twitter/the-algorithm-ml (Python/TensorFlow, ~10.500 Stars) den ersten Open‑Source‑Stand des Empfehlungssystems. Nicht alles war drin — Werbecode, Modellgewichte, Trainingsdaten fehlten — aber genug, um die Architektur nachzuvollziehen.
Am 19. Januar 2026 folgte unter xai-org/x-algorithm (Apache 2.0, primär Rust, ~21.200 Stars) die Neufassung: Home Mixer, Thunder (In‑Memory‑Postspeicher), Phoenix (Two‑Tower‑Retrieval + Grok‑basierter Transformer‑Ranker), Grox‑Content‑Understanding. Die heuristischen Features der alten Pipeline sind weitgehend entfernt — der Transformer „liest" und „sieht" jeden Post.
Das ist keine Petitesse. Es ist der Übergang von einer Engagement‑Vorhersagemaschine zu einer Maschine, die semantisch versteht, worum es in einem Post geht — bevor sie ihn jemandem zeigt.
3.2 Engagement‑Gewichte — warum eine Replik soviel zählt
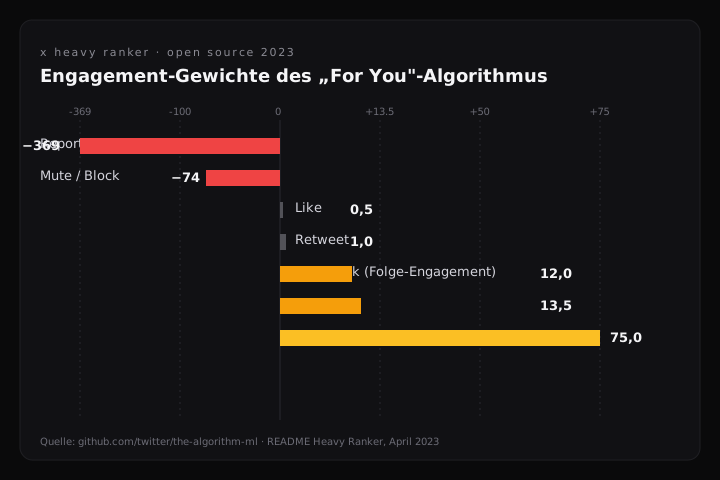
Die Modellgewichte des „Heavy Rankers" (Stand April 2023, im Repo dokumentiert) sind hier zentral. Ich gebe sie unkommentiert wieder, weil sie die wichtigste Einzeltatsache dieses Artikels sind:
Quelle: Commit‑History twitter/the-algorithm-ml, Datei projects/home/recap/README.md.
Eine Antwort ist also 27‑mal soviel wert wie ein Like. Eine Antwort, auf die der Autor reagiert, 150‑mal soviel. Ein Mute oder Block hebt ungefähr eineinhalb Antworten auf. Ein Report wirkt wie 738 negative Likes.
Wer Finance‑Content produziert, hat damit ein Drehbuch in der Hand. Wer auf X einen bärischen Chart‑Take postet, der bullische Follower zum Widerspruch provoziert — und dann höflich, aber pointiert antwortet —, multipliziert seine Reichweite. Wer einen vorsichtig formulierten Multi‑Asset‑Long‑Take ohne Reibungsfläche postet, bekommt Likes und sonst nichts. Das ist kein Verschwörungsdenken, das steht im Quellcode.
3.3 Echo‑Chambers, virale Kaskaden, FinTwit‑Logik
Empirisch belegt: Cookson, Engelberg und Mullins (2023) zeigen im Review of Financial Studies, dass selbsterklärte Bullen mit fünffacher Wahrscheinlichkeit anderen Bullen folgen. Über 50 Tage sehen Bullen 62 zusätzliche bullische Nachrichten und 24 weniger bärische als Bären. Und — das ist die unbequeme Pointe — Anleger, deren Überzeugungen in Echo Chambers entstanden sind, erzielen niedrigere spätere Renditen bei höherem Handelsvolumen.
Gianstefani, Longo und Riccaboni (2022) bestätigen denselben Mechanismus für den GameStop‑Kontext: Social‑Media‑Echo‑Chambers amplifizierten die Meme‑Stock‑Dynamik, Communities votierten populäre Stimmungen hoch, Dissens wurde herausgefiltert, Fundamentaldaten ignoriert.
Der X‑Algorithmus erleichtert diese Cluster‑Bildung strukturell. Das Modul SimClusters teilt Nutzer in etwa 145.000 virtuelle Communities ein. „FinTwit" — die Selbstbezeichnung der englischsprachigen Finanz‑Twitter‑Szene — ist algorithmisch eine dieser dichten Communities. Ein Chart, der dort viral geht, erreicht innerhalb von Stunden die gesamte Subkultur, und genau diese Geschwindigkeit ist es, die The Long Investor mit ~261.000 X‑Followern als Marketing‑Trichter in Patreon‑Abonnements übersetzt.
3.4 Die Grok‑Wende ab November 2025
Im Oktober 2025 kündigte Elon Musk den Übergang auf einen Grok‑basierten Ranker an („unregretted user seconds" als Kernmetrik), im November 2025 war der Übergang abgeschlossen, im Januar 2026 wurde der Code öffentlich. Für Finance‑Content sind drei Konsequenzen wichtig.
Erstens werden Premium‑Accounts (X Premium) laut mehreren unabhängigen Tests bevorzugt — Reichweitenfaktoren von 4 bis 10 gegenüber kostenlosen Accounts werden berichtet, ohne dass X exakte Multiplikatoren bestätigt. Zweitens werden externe Links nicht‑Premium‑Accounts massiv heruntergesetzt (Reichweitenverlust 30–50 % laut Code, in Tests seit März 2025 noch drastischer). Wer als Analyst auf Substack‑ oder Patreon‑Artikel verlinkt, ohne Premium zu sein, postet faktisch ins Leere.
Drittens — und das ist die wirklich neue Dimension — analysiert der Grok‑Ranker den Tonfall. Strikt negative, „rage‑bait"‑artige Finanzposts werden tendenziell gedrosselt, selbst wenn ihr Engagement hoch ist. Was das für Doom‑and‑Gloom‑Charts heißt, ist noch nicht unabhängig vermessen. Plausibel ist eine Verschiebung zugunsten sachlich‑analytischer Tonalität — und damit zugunsten von Accounts wie The Long Investor, die strukturell ruhig posten.
4. Empirische Evidenz: GameStop, Doge, Roaring Kitty
4.1 GameStop, Januar 2021
Die Zahlen kann man nicht oft genug nennen. Vor dem 13. Januar 2021 notierte GME um 20 US‑Dollar. Am 27. Januar schloss die Aktie bei 347,51, vorbörslich am 28. Januar pendelte sie über 500 Dollar, bevor Robinhood und andere Broker den Kauf restringierten. Der SEC‑Staff‑Report vom 18. Oktober 2021 kam zu dem für viele überraschenden Befund, dass weder ein klassischer Short‑Squeeze noch ein Gamma‑Squeeze die Rally trug, sondern „positives Sentiment, kein Eindeckungsdruck".
Die akademische Forschung hat den Fall seither in Dutzenden Papers seziert. Bradley, Hanousek, Jame und Xiao (2024) zeigen, dass r/wallstreetbets‑Empfehlungen vor GME tatsächlich Vorhersagekraft hatten; danach verschwand sie, der Reddit‑Stream wurde von Aufmerksamkeits‑getriebenem Noise dominiert. Eine Studie im International Review of Financial Analysis (2024) quantifiziert: Positionen, die auf dem Höhepunkt der WSB‑Aufmerksamkeit aufgemacht wurden, erzielten −8,5 % Haltedauer‑Rendite.
4.2 Dogecoin und die Musk‑Tweets
Der Doge‑Verlauf 2021 ist der nüchternste Lehrfilm zur Algorithmen‑Macht über Finanzmärkte. Ein „One word: Doge"‑Tweet im Dezember 2020 trieb den Kurs um 20 Prozent. Die WSB‑adjazente Rally im Januar 2021 brachte 800 Prozent in 24 Stunden. „Dogecoin is the people's crypto" am 4. Februar: +40 bis 50 Prozent. „The Dogefather SNL May 8" am 28. April: +20 Prozent. Am 8. Mai 2021 erreichte DOGE intraday rund 0,73 US‑Dollar, fiel dann bis zu 29,5 Prozent vom Peak; die Marktkapitalisierung lag kurzzeitig über 80 Milliarden Dollar.
Die Klage gegen Musk wegen behaupteter DOGE‑Manipulation wurde später abgewiesen. Wichtig ist nicht der juristische Ausgang, sondern die Sichtbarkeit der Mechanik: Ein einzelner Account konnte 2021 ohne jeden regulatorischen Eingriff einen Asset‑Preis dreistellig bewegen, weil die algorithmische Verstärkung in Sekunden funktionierte.
4.3 Bed Bath & Beyond und Roaring Kittys Comeback
Bei BBBY im August 2022 zeigte sich, wie schmal der Grat zwischen Meme‑Rally und mutmaßlichem Pump‑and‑Dump ist. Ryan Cohens RC Ventures meldete im März 2022 einen 9,8‑Prozent‑Anteil. Am 12. August 2022 postete Cohen das berühmte Smiling‑Moon‑Emoji, am 17. August stand die Aktie intraday bei rund 28,60 Dollar (+78,8 %), am 18. August reichte Cohen sein Form 144 zur Veräußerung ein — Kurssturz rund 40 Prozent. Geschätzter Gewinn Cohens: ~60 Mio. Dollar. Im April 2023 ging BBBY in Chapter 11.
Im Mai 2024 kehrte Keith Gill alias Roaring Kitty auf X zurück. Ein einziges Meme‑Bild am 12. Mai. GME öffnete am 13. Mai bei 26,34 Dollar (+50,6 % gegenüber Vortagsschluss 17,49). Ein Reddit‑Posting am 2. Juni offenbarte eine Position von 5 Millionen Aktien plus 120.000 Call‑Optionen mit Strike 20 und Verfall 21. Juni — Gesamtexposure deutlich über 180 Mio. Dollar. Am 7. Juni begann sein erster Livestream nach drei Jahren; GME schloss den Tag mit −25 % intraday‑Tief.
Es ist die idealtypische Illustration dessen, was Theoretiker mit „informational cascade" meinen — und was Praktiker als Self‑Fulfilling Prophecy erleben.
4.4 Was die Forschung zu Reddit und X zeigt
Über Einzelfälle hinaus hat sich die Empirie inzwischen verdichtet. Hu, Jones, Zhang und Zhang (2023) zeigen, dass Reddit‑Aktivität Preis, Volumen, Volatilität und Retail‑Orderflow vorhersagt und gleichzeitig Short‑Seller abschreckt. Bollen, Mao und Zeng (2011) — heute Klassiker — fanden eine 87,6‑prozentige Trefferquote bei der Tagesrichtung des DJIA mittels Twitter‑Mood, allerdings mit Replikationsproblemen. Eine Deep‑Learning‑Studie 2024 berichtet R²‑Verbesserungen bis 12 Prozent und RMSE‑Reduktionen von 30 bis 60 Prozent für Aktienprognosen unter Einbezug von Tweet‑Sentiment.
Die CFA‑Institute‑Analyse vom Oktober 2024 fasst zusammen: Misinformations‑Schocks erzeugen vorübergehende, aber heftige Volatilitätsspitzen; algorithmische Amplifikation falscher Inhalte ist ein systemisches Risiko.
5. Nuancen, Kritik, Edge Cases
5.1 Self‑Fulfilling Prophecy als Falle
Die Self‑Fulfilling‑Prophecy‑Logik hat eine unangenehme Kehrseite: Was sich selbst erfüllt, kann sich auch selbst zerstören. Sobald genug Marktteilnehmer dieselbe Unterstützungslinie kennen, plazieren sie ihre Stops dort. Sobald der Kurs die Linie durchsticht, kaskadieren die Stops — der „Bruch" wird zur Selbsterfüllung, der „Halt" zur Falle. Bei Brock, Lakonishok und LeBaron (1992) wirkten einfache MA‑Regeln auf DJIA‑Daten 1897–1986 noch profitabel; Sullivan, Timmermann und White (1999) zeigten, dass dieselben Regeln out‑of‑sample nach 1986 ihre Performance verloren — vermutlich, weil zu viele dieselben Regeln entdeckten.
5.2 Overconfidence — das chronische Retail‑Problem
Brad Barber und Terrance Odean haben in einer beeindruckenden Serie nachgewiesen, dass aktive Privatanleger systematisch unterperformen. 1991–1996 erzielten die aktivsten 20 % von 66.465 untersuchten Haushalten netto 11,4 % gegenüber 17,9 % für den Markt. Männer handeln 45 % mehr als Frauen und verdienen 1,4 Prozentpunkte weniger pro Jahr. Eine Taiwan‑Studie 2014 fand, dass weniger als 1 % der Daytrader vorhersagbar positive risikoadjustierte Nettorenditen erzielen.
In Communities mit Live‑Chart‑Sessions, in denen jeder „sieht", was die Profis tun, ist Overconfidence besonders ansteckend.
5.3 Algorithmus‑Updates als Störfaktor
Wer sein Geschäftsmodell auf einen Algorithmus aufbaut, baut auf Sand. Die X‑Updates seit 2023 — Premium‑Boost, Link‑Penalty, Grok‑Übergang, „unregretted user seconds" — haben mehrfach die Reichweitenlogik geändert. Ein Account, der 2023 mit aggressiven Bear‑Takes wuchs, kann 2026 von der Sentiment‑Drosselung getroffen werden. Wer auf externe Substack‑Links setzte, ist seit März 2025 quasi unsichtbar, wenn er nicht Premium‑Abonnent ist.
5.4 KI‑gestützte TA in der Zukunft
Der spannendste Edge Case ist die KI‑gestützte technische Analyse, die durch Grok‑artige Modelle in den Mainstream wandert. Plattformen experimentieren mit Pattern‑Detection per neuronalen Netzen; The Long Investor selbst hat in Posts angedeutet, KI‑Tools zu nutzen. Wenn diese Modelle dieselben Muster erkennen, die menschliche Trader zeichnen, beschleunigt sich der Cascade‑Effekt weiter. Wenn sie andere Muster finden, entsteht eine zweite Schicht von „Markt‑Linien", die nur Maschinen sehen — und auf die der Markt nachzeichnet, weil maschinelle Aufträge in Sekundenbruchteilen darauf reagieren.
6. Regulierung: Was die Maschine bremsen soll
6.1 Der EU Digital Services Act
Der DSA ist seit November 2022 in Kraft. Für die als Very Large Online Platforms designierten Anbieter — X gehört dazu — gelten die Pflichten seit 25. August 2023; für kleinere Plattformen seit 17. Februar 2024.
Drei Artikel sind für Finance‑Content unmittelbar relevant. Artikel 27 verpflichtet alle Plattformen zur Offenlegung der „main parameters" ihrer Empfehlungssysteme. Artikel 38 verlangt von VLOPs mindestens eine nicht‑profiling‑basierte Empfehlungsoption — wer X nutzt, kann seit 2024 zwischen „For You" und „Following" wählen, was direkt aus dieser Vorschrift folgt. Artikel 39 ordnet ein öffentliches Anzeigen‑Register an. Die Artikel 34/35 fordern systemische Risikoanalysen — der Hebel, mit dem Regulatoren Algorithmusrisiken adressieren können.
Im Januar 2026 hat die EU‑Kommission gegen X im DSA‑Kontext Verfahren zu Transparenzpflichten geführt; die Wechselwirkung mit der Algorithmus‑Open‑Sourcing‑Strategie ist offen.
6.2 MiFID II und die ESMA‑Warnung an Finfluencer
MiFID II verlangt seit 2018, dass Marketing‑Kommunikation fair, klar und nicht irreführend sein muss. Die ESMA hat das 2024 explizit auf Social‑Media‑Influencer ausgedehnt. Am 6. Februar 2024 veröffentlichte sie eine Warning for people posting investment recommendations on social media (ESMA74‑1103241886‑912) und erweiterte die Anforderungen aus MAR Art. 20 — Objektivität, Identitätsoffenlegung, Interessenkonflikte — auf jeden, der investmentbezogene Posts mit Empfehlungscharakter teilt.
Das ist juristisch heikel. Ein Chart‑Post mit „Ich bin long $X, Target 250" ist eine Investment‑Empfehlung im Sinne der EU‑Definition. Wer das ohne Disclaimer postet, riskiert formal MAR‑Verstöße.
6.3 BaFin: zwischen Warnung und Lücke
Die BaFin hat im Februar 2022 erstmals öffentlich vor Investmenttipps in sozialen Medien gewarnt, im Oktober 2024 darauf hingewiesen, dass 18‑ bis 45‑Jährige, die Finfluencern folgen, viermal so häufig Krypto‑Assets kaufen wie der Durchschnitt (48 % vs. 13 %). Am 9. Januar 2026 erschien das ESMA/BaFin‑Factsheet für Finfluencer mit klaren Regeln zu Verantwortlichkeit, Transparenz und der ausdrücklichen Klarstellung, dass „Dies ist keine Anlageberatung"‑Disclaimer keinen rechtlichen Schutz bieten.
Gleichzeitig hat das 2025er BaFin‑Merkblatt entschieden, dass Finfluencer in der Regel nicht als Anlageberater klassifiziert werden, weil sie keine individuellen Empfehlungen geben. Berufsverbände wie BVK und AfW kritisieren das als regulatorische Lücke.
Dokumentierte Betrugsfälle gibt es genug. Im Münchner Raum verlor ein Anleger 140.000 Euro über eine WhatsApp‑Aktiengruppe, ein weiterer 87.000 Euro in wenigen Wochen. Bekannte Finfluencer wie Finanzfluss, Marc Friedrich und Kolja Barghoorn werden seit 2024/2026 systematisch per Deepfake imitiert.
6.4 MiCA — die Krypto‑Lücke schließt sich
Die EU‑Verordnung Markets in Crypto‑Assets (Reg. 2023/1114) ist seit 30. Dezember 2024 voll anwendbar. Titel VI etabliert ein Marktmissbrauchsregime für Krypto‑Assets, das in seiner Struktur MAR nachgebildet ist: Insiderhandel, unrechtmäßige Offenlegung, Marktmanipulation, ausdrücklich auch durch „Verbreitung falscher oder irreführender Signale über jedes Medium, einschließlich sozialer Medien".
Ein Doge‑Pump‑Tweet wie 2021 wäre 2026 in EU‑Jurisdiktion potenziell verfolgbar. Ob ESMA und nationale Aufsichten die Mittel haben, das praktisch durchzusetzen, ist eine andere Frage.
7. Praktische Implikationen für ambitionierte Privatanleger
Wenn man die Mechanik verstanden hat — Chart als Schelling‑Punkt, Community als Cascade‑Verstärker, Algorithmus als Geschwindigkeitsmultiplikator —, ist die Frage nicht mehr, ob man mitmacht. Die Frage ist, wie. Ein paar Beobachtungen, die ich selbst aus zwei Jahren mit Communities und Charts mitgenommen habe.
Erstens: Verstehen, in welchem Cluster man sitzt. Wer drei TA‑Accounts auf X folgt, sitzt nach wenigen Wochen in einem SimCluster, der ihm primär TA‑Content zeigt — bullisch oder bärisch, je nach Eingangswahl. Das ist nicht neutral. Die Cookson‑Studie ist hier deprimierend klar: Echo‑Chambers korrelieren mit schlechteren Renditen. Wer das ernst nimmt, kuratiert seinen Feed mit Reibung — gegensätzliche Stimmen, andere Methoden, FA‑lastige Accounts neben TA‑lastigen.
Zweitens: Sentiment lesen, nicht folgen. Der Fear & Greed Index ist nicht akademisch validiert, aber als Stimmungsthermometer brauchbar. Wer bei „Extreme Greed" anfängt, Positionen zu reduzieren, und bei „Extreme Fear" über antizyklische Käufe nachdenkt, hat eine einfache Heuristik gegen die eigene Cascade‑Anfälligkeit. Es ersetzt keine Strategie. Es schützt vor dem Worst Case, am Hoch alles zu kaufen.
Drittens: Eine kleine Checkliste für Chart‑Communities — egal ob The Long Investor, Wir Lieben Aktien oder ein Telegram‑Signal‑Kanal:
- Ist die Methodologie falsifizierbar? Elliott Wave und ähnlich flexible Frameworks sind brillant zur Erzählung, schwer zur Überprüfung. Frage: Wann gilt eine Zählung als widerlegt?
- Gibt es einen geprüften Track Record? Anonyme Accounts ohne unabhängig auditierte Performance sind kein Disqualifikationsgrund, aber ein Risikoaufschlag.
- Sind die Disclaimer ehrlich oder kosmetisch? „Keine Anlageberatung" ist seit BaFin Januar 2026 explizit kein rechtlicher Schutz.
- Wie ist das Verhältnis von kostenlosem Marketing zu bezahltem Mehrwert? X als Trichter ist legitim, das Preisniveau entscheidet — 33,50 Euro/Monat ist eine andere Hausnummer als 447,50.
- Ist die Community kritikfähig? Server, in denen jede Gegenrede gelöscht wird, sind Echo‑Chambers per Design.
Viertens: Algorithmus‑Risiko in die Strategie einpreisen. Wer ein Setup auf X verbreitet sieht, weiß zwei Dinge gleichzeitig: Es wird wahrscheinlich kurzfristig laufen (Self‑Fulfilling Prophecy), und es wird langfristig vermutlich schlechter performen als ein still entdecktes Setup (Park & Irwin; Barber & Odean). Wer das ignoriert, kauft Reichweite, nicht Edge.
Fünfter und letzter Punkt — persönlich: Mir ist in zwei Jahren Beobachtung wichtig geworden, zwischen Inspiration und Delegation zu unterscheiden. Eine Community kann eine großartige Ideenquelle sein. Sobald sie zur Entscheidungsquelle wird, bin ich nicht mehr Anleger, sondern Follower. Und der Algorithmus, der mir die Posts vorsortiert, ist nicht mein Freund. Er ist eine Maschine zur Maximierung verbrachter Sekunden.
8. Ausblick
Wenn man die Linien des Jahres 2026 verlängert, läuft alles auf zwei Beschleunigungen hinaus. Erstens die regulatorische: DSA, MiCA, ESMA‑Warnungen und das BaFin‑Factsheet bauen ein engeres Netz um Finfluencer und Plattformen. Es ist nicht zu erwarten, dass dieses Netz die Communities verschwinden lässt — wohl aber, dass es ihre Disclaimer länger, ihre Werbedeals transparenter und ihre Pump‑and‑Dump‑Anfälligkeit kleiner macht.
Zweitens die technische: Grok‑basierte Ranker und KI‑gestützte TA‑Tools verschieben das Spielfeld weiter. Vermutlich verändert sich die Sprache der Community — der Tonfall wird ruhiger, weil rage‑bait ausgedrosselt wird. Vermutlich entstehen neue Cluster‑Strukturen, weil die Maschine semantisch und nicht mehr nur engagement‑mäßig einordnet. Und vermutlich wächst die Asymmetrie zwischen Premium‑Accounts mit Reichweitenmultiplikator und kostenlosen Stimmen weiter, solange die Plattform daran verdient.
Für deutschsprachige Anleger bleibt die nüchterne Beobachtung, dass die wichtigste Bewegung der letzten zehn Jahre — die Verdoppelung der Aktionärszahl auf 14,1 Millionen — nicht durch Chart‑Communities getrieben wurde, sondern durch ETF‑Sparplan‑Bildung. Die TA‑Welt ist ein faszinierendes Feld, in dem man viel über Märkte, mehr noch über Menschen lernen kann. Sie ist nur selten der kürzeste Weg zu Vermögensbildung.
Wer trotzdem traden will — und das ist ein legitimer, intellektuell anspruchsvoller Weg —, sollte sich nicht von der Lautstärke des Algorithmus beeindrucken lassen, sondern von der Disziplin des eigenen Prozesses. Charts sind Spiegel. Spiegel zeigen viel, aber sie zeigen nicht die Tür.
Quellenverzeichnis
- Banerjee, A. V. (1992). A Simple Model of Herd Behavior. Quarterly Journal of Economics, 107(3), 797–817.
- Barber, B. M., & Odean, T. (2000). Trading Is Hazardous to Your Wealth. Journal of Finance, 55(2), 773–806.
- Barber, B. M., & Odean, T. (2001). Boys Will Be Boys. Quarterly Journal of Economics, 116(1), 261–292.
- Barber, B. M., Lee, Y.‑T., Liu, Y.‑J., & Odean, T. (2014). The Cross‑Section of Speculator Skill. JFQA, 49(2), 367–391.
- BaFin (2026). Factsheet für Finfluencer.
- Bikhchandani, S., Hirshleifer, D., & Welch, I. (1992). A Theory of Fads, Fashion, Custom, and Cultural Change as Informational Cascades. Journal of Political Economy, 100(5).
- Biallo (2026) — Aktionärszahlen DAI 2026.
- Bloomberg (2024) — GameStop surges as Roaring Kitty return adds fuel to rally.
- Bollen, J., Mao, H., & Zeng, X. (2011). Twitter mood predicts the stock market. Journal of Computational Science, 2(1).
- Brock, W., Lakonishok, J., & LeBaron, B. (1992). Simple Technical Trading Rules and the Stochastic Properties of Stock Returns. Journal of Finance, 47(5).
- Brown, S. J., Goetzmann, W. N., & Kumar, A. (1998). The Dow Theory: William Peter Hamilton's Track Record Reconsidered. Journal of Finance, 53(4).
- CFA Institute (2024) — From Tweets to Trades.
- CNN Business — Fear & Greed Index.
- Cookson, J. A., Engelberg, J. E., & Mullins, W. (2023). Echo Chambers. Review of Financial Studies, 36(2).
- Da, Z., Engelberg, J., & Gao, P. (2015). The Sum of All FEARS. Review of Financial Studies, 28(1).
- Das Investment (2025) — BaFin‑Merkblatt zu Finfluencern in der Kritik.
- Decrypt (2021) — Elon Musk's Dogecoin/Bitcoin Tweets Timeline.
- Edwards, R. D., & Magee, J. (1948/2018). Technical Analysis of Stock Trends (11. Aufl.). CRC Press.
- ESMA (2024). Warning for people posting investment recommendations on social media.
- Europäische Kommission — DSA: Very large online platforms and search engines.
- Fortune (2023) — Ryan Cohen under SEC investigation over BBBY trades.
- Gianstefani, I., Longo, L., & Riccaboni, M. (2022). The echo chamber effect resounds on financial markets.
- GitHub — twitter/the-algorithm.
- GitHub — xai‑org/x‑algorithm.
- Graphtreon — The Long Investor.
- Hamilton, W. P. (1922). The Stock Market Barometer. Harper & Brothers.
- Hu, D., Jones, C. M., Zhang, V., & Zhang, X. (2023). The Rise of Reddit: How Social Media Affects Retail Investors and Short‑Sellers' Roles in Price Discovery.
- Kindleberger, C. P., & Aliber, R. Z. (2015). Manias, Panics, and Crashes (7. Aufl.). Palgrave Macmillan.
- Lo, A. W. (2004). The Adaptive Markets Hypothesis. Journal of Portfolio Management, 30(5).
- Lo, A. W., Mamaysky, H., & Wang, J. (2000). Foundations of Technical Analysis. Journal of Finance, 55(4).
- Menkhoff, L. (2010). The Use of Technical Analysis by Fund Managers. Journal of Banking & Finance, 34(11).
- Park, C.‑H., & Irwin, S. H. (2007). What Do We Know About the Profitability of Technical Analysis? Journal of Economic Surveys, 21(4).
- Rhea, R. (1932). The Dow Theory. Barron's.
- SEC (2021) — Staff Report on Equity and Options Market Structure Conditions in Early 2021.
- Shiller, R. J. (2000). Irrational Exuberance. Princeton University Press.
- Social Media Today (2025) — X switching to fully AI‑powered Grok algorithm.
- Sullivan, R., Timmermann, A., & White, R. (1999). Data‑Snooping, Technical Trading Rule Performance, and the Bootstrap. Journal of Finance, 54(5).
- TechCrunch (2026) — X open sources its algorithm.
- The Long Investor — Patreon About.
- Twitter Engineering Blog (2023) — Twitter Recommendation Algorithm.
- Wikipedia — GameStop short squeeze.
Glossar
Adaptive Markets Hypothesis (AMH) — Von Andrew Lo formulierte Synthese aus EMH und Behavioral Finance. Cashtag — Aktien‑ oder Krypto‑Symbol mit Dollarzeichen ($AAPL, $BTC); algorithmischer Topic‑Marker. Echo Chamber — Informationsumgebung, in der Nutzer überwiegend bestätigende Inhalte sehen. Elliott Wave — Methode, Kursbewegungen als fünf Impuls‑ + drei Korrekturwellen zu interpretieren. FinTwit — Selbstbezeichnung der englischsprachigen Finance‑Community auf X. Heavy Ranker — ML‑Modell des X‑Algorithmus, das Engagement‑Wahrscheinlichkeiten vorhersagt. Informational Cascade — Situation, in der Akteure eigene Information zugunsten beobachteten Verhaltens ignorieren. MAR (Market Abuse Regulation) — EU 596/2014; reguliert Insiderhandel und Marktmanipulation, Art. 20 betrifft Investment Recommendations. MiCA — Markets in Crypto‑Assets Regulation; voll anwendbar seit 30.12.2024. Schelling‑Punkt — Koordinationspunkt, an dem sich Erwartungen ohne explizite Absprache treffen. Self‑Fulfilling Prophecy — Erwartung, die durch das Handeln nach ihr selbst eintritt. SimCluster — Eine von ~145.000 virtuellen Communities im X‑Algorithmus. Unregretted User Seconds — Verweildauer abzüglich „bereuter" Aktionen (Mute/Block/Report).
Letzte Aktualisierung: 16. Mai 2026. Autor: Dominik Weyh.
Charts as a Collective Mind Map
How the X algorithm drives retail communities from The Long Investor to DACH sentiment.
Why the lines on your screen reveal the crowd watching the market more often than the market itself. A reckoning between behavioral finance, the Patreon economy, and an algorithm whose internals have been sitting on GitHub as Rust code since early 2026.
On January 27, 2021, the r/wallstreetbets subreddit logged roughly 73 million page views in a single day. GameStop closed at $347.51. Three years later, on May 13, 2024, a single meme image on X and the reactivated account of Keith Gill were enough to lever the stock by more than 50 percent within hours. Nothing about market theory changed between those two days. What changed was the infrastructure — Patreon subscriptions in four‑ and five‑digit member counts, Discord servers with live chart sessions, and a recommendation algorithm rewritten multiple times between 2023 and 2026 that now "reads" almost every nuance of every finance‑related post before deciding who sees it.
This essay tries to combine three things that German‑language financial media tend to treat separately: the old idea that technical analysis is mostly a mirror of mass psychology; the new, non‑organized retail communities on Patreon, Discord, and Telegram, of which The Long Investor, with more than 11,000 paying members, is one of the largest worldwide; and the amplifier connecting them — the X algorithm, whose engagement weights have been public since March 2023 and which has existed in a Grok‑based rewrite since January 2026.
The thesis isn't new, but it deserves empirical scrutiny: technical analysis works not despite, but because it coordinates expectations — and the X algorithm provides the fastest coordination machine retail investors have ever had. That's opportunity and risk in one breath.
1. Charts as a Collective Mind Map
1.1 Dow, Hamilton, Rhea — the oldest mirrors
Charles Dow never wrote a book on the theory bearing his name. His legacy lives in 255 Wall Street Journal editorials between 1899 and 1902. His successor William Peter Hamilton distilled the observations in The Stock Market Barometer (1922); Robert Rhea formalized them in The Dow Theory (1932) in the three propositions every trader still memorizes today: trends operate on three timescales, markets pass through three phases, indices must confirm each other.
Few people know that Hamilton's track record has been academically tested. Brown, Goetzmann, and Kumar replicated his WSJ calls in 1998 (Journal of Finance) with a neural network and found risk‑adjusted excess returns. That's one of the rare studies attesting empirical legitimacy to a technical method — and, of all things, to a 100‑year‑old one.
Edwards & Magee's Technical Analysis of Stock Trends (1948, now in its 11th edition) is the other foundation. Both works share an assumption Dow only made implicitly: the market is a discounting mechanism for the mental states of its participants. If that's true, a chart isn't a picture of the company. It's a picture of the people trading it.
1.2 Herd behavior and informational cascades
The formal theory came later. Abhijit Banerjee, later a Nobel laureate in economics, described in his 1992 paper "A Simple Model of Herd Behavior" how rational actors abandon their own signals once they observe what others are doing. At the same time, Bikhchandani, Hirshleifer, and Welch developed the theory of "informational cascades": once enough market participants act in the same direction, it becomes individually rational to follow — even against one's private knowledge.
Robert Shiller had already laid the empirical groundwork in 1984 in Brookings Papers on Economic Activity: prices move further than fundamentals could ever justify. His later Irrational Exuberance (2000) appeared months before the dot‑com crash — rarely has a book timed itself better.
Anyone doing technical analysis is in essence reading cascades, searching for the moment the crowd tips. Charles Kindleberger and Robert Aliber traced this logic through history in Manias, Panics, and Crashes, from tulip mania to subprime.
1.3 Fear & Greed — sentiment as a tradeable commodity
The CNN Fear & Greed Index, launched in 2012 by CNNMoney, is today the best‑known sentiment indicator there is. Seven components — market momentum, 52‑week highs/lows, McClellan Volume Summation, put/call ratio, VIX, safe‑haven demand, junk bond demand — get combined into a number between 0 and 100.
It is not academically validated. It's a journalistic composite, not a peer‑reviewed indicator. For clean academic work, Da, Engelberg & Gao (2015) build a similar "FEARS" proxy from Google search queries — with documented predictive power in the Review of Financial Studies. But as the community's lingua franca, Fear & Greed is unbeatable. When the index drops below 25, half of FinTwit writes "extreme fear," and that, too, is information.
1.4 Self‑fulfilling prophecy — does TA work because we all believe in it?
The methodologically cleanest answer to whether technical analysis "works" comes from Andrew Lo, Harry Mamaysky, and Jiang Wang (2000): using kernel regression, they algorithmically detected ten classical patterns — head‑and‑shoulders, double tops, etc. — on US stocks 1962–1996. Several patterns carried statistically significant incremental information. This was the academic partial rehabilitation of chartism.
Park and Irwin (2007) drew the meta‑balance in the Journal of Economic Surveys from 95 modern studies: 56 positive, 20 negative, 19 mixed. The profitability of TA rules declines over time — consistent with Lo's later Adaptive Markets Hypothesis (2004): strategies work, are adopted, get arbitraged away, and re‑emerge elsewhere.
Decisive for our question: Lukas Menkhoff showed in 2010, surveying 692 fund managers across five countries, that 87 percent give technical analysis at least some weight — especially on short horizons and in FX. The self‑fulfilling‑prophecy mechanism isn't speculation. When almost all professionals draw the same lines, those lines become Schelling points — coordination points where order books pile up.
And that is exactly the mechanism the following chapters attach to: communities collectively draw the same lines, the algorithm amplifies visibility, clusters react — and the chart turns out to have been right in hindsight.
2. Non‑organized retail communities: the new center
2.1 The Long Investor — anatomy of a Patreon machine
Whoever encounters the name The Long Investor on X for the first time tends to treat it as one small account among many. In fact, the project ranks among the three largest finance Patreons in the world. According to Graphtreon — the long‑established Patreon analytics platform — The Long Investor currently has around 11,187 paying members and roughly 24,290 total followers; rank 68 in the overall Patreon ranking, second or third in the Finance category. The account launched on November 11, 2022. In three and a half years, the project has reached a scale German wealth managers need decades for.
The mechanics are methodologically hybrid: Elliott Wave analysis as the technical backbone, combined with fundamental deep dives, a weekly "LIT Sunday News" newsletter, regularly updated Top‑10 and Top‑20 lists, and roughly 15 annotated charts per day. Three time horizons (0–1, 1–5, 5+ years), explicit investment rules ("Don't Day Trade", "Never use Options", "Never use Leverage"), and a premium tier called Executive Lounge at roughly €447.50 per month with a private Telegram group and personal buy/sell alerts.
Little is publicly known about the founder — they operate anonymously, describing themselves as an airline captain with a B.A. in International Business & Economics and 17 years of finance industry experience. None of that is verifiable. The Trustpilot page that circulates under a similar name refers to a different entity (longinvest.biz), not the Patreon account. For a business that conservatively turns over a high six‑figure sum per month, the anonymity is a point every subscriber has to weigh for themselves.
After tracking the daily charts for several months, my impression was mixed. The craftsmanship of the Elliott annotations is high, the line work disciplined, the style calm — the account does not sell hysteria. At the same time, Elliott Wave as a method is notoriously flexible: a count called "Wave 4" yesterday can be "extended Wave 2" tomorrow without ever meeting empirical falsification. That flexibility is part of the business model. It keeps the community talking.
2.2 The DACH landscape beyond "finX"
A factual note is needed here: the name "finX" is often used in the German‑speaking world as a catch‑all for German‑language finance communities, but a standalone large Patreon or Discord platform under that exact name cannot be conclusively verified. What goes under "finX" is usually FINX Global (a crypto/Web3 infrastructure project), the Global X FinTech ETF (ticker FINX), or the Finnex student club at Nordakademie — none of them German‑language retail trading communities.
The actual counterparts to The Long Investor in the DACH region look different, and it's worth sorting them cleanly:
YouTube, Discord, Instagram
~2.58 M YouTube, 600K+ Instagram, ~37–64K Discord
ETF savings plans, broad education
~375,000
Passive, ETF, dogmatic
~120,000
DAX‑YOLO memes, warrants
Discord + Premium
~12,500 Discord
TA + FA, hidden champions
Discord + courses
active
Day trading, chart education
since 2015
News‑driven day trading, DAX/Forex
~500K+ reach
Women, financial education
The scales aren't directly comparable. While The Long Investor has about 11,000 paying members, most DACH names are free‑reach players with much smaller premium tiers. Switzerland's Sparkojote (Thomas Kovacs), for instance, has under 1,500 Discord members; his reach is primarily YouTube and podcast.
The most important structural observation: the DACH scene is less chart‑centric than the US one. r/Finanzen is openly hostile toward technical analysis, r/mauerstrassenwetten uses it semi‑ironically, and Wir Lieben Aktien and Chartsekte are the few prominent communities with real TA substance. The drivers of the German equity boom — 14.1 million shareholders in 2025 according to the Deutsches Aktieninstitut — are not chart communities, but ETF savings plans and Finanzfluss tutorials.
2.3 USA vs. DACH — two investment cultures
The contrast is illuminating because it explains why a phenomenon like The Long Investor (English‑language, US/Ireland‑based, Elliott Wave method, around 261,000 X followers) is essentially absent from German‑language discussion. US retail culture is options‑focused, derivative‑heavy, organized in Patreon/Discord premium structures. DACH culture is savings‑plan‑driven, ETF‑centered, at home in YouTube education formats. Charts are discussed more often on TradingView (in the German "Handelsideen" section) than inside closed paid communities.
This asymmetry isn't pure mentality. It follows from the product landscape: in the US, retail trades CBOE‑standardized options with transparent pricing; in Germany, bank‑issued OTC warrants dominate, whose pricing is harder to read from the outside. On top of that comes regulation, which we revisit in chapter 6.
3. The X algorithm as accelerator
3.1 What the GitHub releases reveal
On March 31, 2023, the then‑Twitter engineering team published the first open‑source state of the recommendation system under twitter/the-algorithm (Scala, today ~73,000 GitHub stars) and twitter/the-algorithm-ml (Python/TensorFlow, ~10,500 stars). Not everything was included — ad code, model weights, and training data were missing — but enough to understand the architecture.
On January 19, 2026, the rewrite followed under xai-org/x-algorithm (Apache 2.0, primarily Rust, ~21,200 stars): Home Mixer, Thunder (in‑memory post store), Phoenix (two‑tower retrieval + Grok‑based transformer ranker), Grox content understanding. The heuristic features of the old pipeline have largely been removed — the transformer "reads" and "watches" every post.
This isn't a footnote. It's the transition from an engagement prediction machine to one that semantically understands what a post is about before deciding who sees it.
3.2 Engagement weights — why a reply counts so much
The Heavy Ranker model weights (April 2023, documented in the repo) are central here. I give them without commentary, because they are the single most important fact in this essay:
Source: commit history twitter/the-algorithm-ml, file projects/home/recap/README.md.
A reply is worth 27 times a like. A reply the author engages with is worth 150 times. A mute or block cancels about one and a half replies. A report acts like 738 negative likes.
Anyone producing finance content now has a script in hand. Posting a bearish chart take that provokes bullish followers to argue back — then replying politely but pointedly — multiplies reach. Posting a carefully phrased multi‑asset long take with no friction yields likes and not much else. This isn't conspiracy thinking; it's literally in the source code.
3.3 Echo chambers, viral cascades, FinTwit logic
Empirically established: Cookson, Engelberg, and Mullins (2023) show in the Review of Financial Studies that self‑declared bulls are five times more likely to follow other bulls. Over 50 days, bulls see 62 additional bullish messages and 24 fewer bearish ones than bears do. And — the uncomfortable punchline — investors whose beliefs form inside echo chambers achieve lower subsequent returns with higher trading volume.
Gianstefani, Longo, and Riccaboni (2022) confirm the same mechanism for the GameStop context: social‑media echo chambers amplified meme‑stock dynamics, communities upvoted popular sentiment, dissent was filtered out, fundamentals were ignored.
The X algorithm structurally facilitates this clustering. The SimClusters module divides users into roughly 145,000 virtual communities. "FinTwit" — the self‑label of the English‑language finance Twitter scene — is algorithmically one of these dense communities. A chart that goes viral there reaches the entire subculture within hours — and that speed is exactly what The Long Investor translates, via its ~261,000 X followers, into Patreon subscriptions.
3.4 The Grok shift from November 2025
In October 2025, Elon Musk announced the move to a Grok‑based ranker ("unregretted user seconds" as the core metric), in November 2025 the transition was complete, in January 2026 the code went public. For finance content, three consequences matter.
First, Premium accounts (X Premium) are favored, according to multiple independent tests — reach factors of 4 to 10 over free accounts are reported, though X has not confirmed exact multipliers. Second, external links from non‑Premium accounts are heavily downranked (30–50% reach loss in the code, even more in tests since March 2025). Linking to a Substack or Patreon article as a non‑Premium analyst is essentially posting into the void.
Third — and this is the genuinely new dimension — the Grok ranker analyzes tone. Strictly negative, rage‑bait‑style finance posts tend to be throttled, even at high engagement. What that means for doom‑and‑gloom charts hasn't been independently measured yet. A plausible shift is toward calm, analytical tone — and thus toward accounts like The Long Investor, which structurally post quietly.
4. Empirical evidence: GameStop, Doge, Roaring Kitty
4.1 GameStop, January 2021
The numbers bear repeating. Before January 13, 2021, GME traded around $20. On January 27, it closed at $347.51; pre‑market on January 28 it briefly swung above $500 before Robinhood and other brokers restricted buying. The SEC Staff Report of October 18, 2021 reached the surprising conclusion that neither a classic short squeeze nor a gamma squeeze sustained the rally, but rather "positive sentiment, not buying‑to‑cover."
Academic research has since dissected the case in dozens of papers. Bradley, Hanousek, Jame, and Xiao (2024) show that r/wallstreetbets recommendations had genuine predictive power before GME; afterward, that power disappeared, and the Reddit feed was dominated by attention‑driven noise. A 2024 study in International Review of Financial Analysis quantifies it: positions opened at peak WSB attention realized a −8.5 % holding‑period return.
4.2 Dogecoin and the Musk tweets
The Doge trajectory of 2021 is the most sober teaching film on algorithmic power over financial markets. A "One word: Doge" tweet in December 2020 moved the price up 20 percent. The WSB‑adjacent January 2021 rally brought 800 percent in 24 hours. "Dogecoin is the people's crypto" on February 4: +40 to 50 percent. "The Dogefather SNL May 8" on April 28: +20 percent. On May 8, 2021, DOGE peaked intraday at roughly $0.73 before falling up to 29.5 percent from the peak; market cap briefly exceeded $80 billion.
The lawsuit against Musk for alleged DOGE manipulation was later dismissed. What matters isn't the legal outcome but the visibility of the mechanism: in 2021, without any regulatory intervention, a single account could move an asset price three digits because algorithmic amplification operated in seconds.
4.3 Bed Bath & Beyond and Roaring Kitty's comeback
BBBY in August 2022 showed how thin the line between meme rally and alleged pump‑and‑dump can be. Ryan Cohen's RC Ventures disclosed a 9.8% stake in March 2022. On August 12, 2022, Cohen posted the famous smiling‑moon emoji; on August 17, the stock traded intraday around $28.60 (+78.8 %); on August 18, Cohen filed his Form 144 for sale — the stock plunged about 40 percent. Cohen's estimated profit: ~$60 million. BBBY filed for Chapter 11 in April 2023.
In May 2024, Keith Gill alias Roaring Kitty returned to X. A single meme image on May 12. GME opened at $26.34 on May 13 (+50.6 % vs. prior close $17.49). A June 2 Reddit post revealed a position of 5 million shares plus 120,000 call options at $20 strike expiring June 21 — total exposure well over $180 million. On June 7, his first livestream in three years began; GME closed the day with a −25 % intraday low.
It's the textbook illustration of what theorists mean by "informational cascade" — and what practitioners experience as self‑fulfilling prophecy.
4.4 What the research on Reddit and X shows
Beyond individual cases, the evidence has solidified. Hu, Jones, Zhang, and Zhang (2023) show that Reddit activity predicts price, volume, volatility, and retail order flow, while deterring short sellers. Bollen, Mao, and Zeng (2011) — now a classic — found 87.6 percent accuracy on daily DJIA direction using Twitter mood, with replication concerns. A 2024 deep‑learning study reports R² improvements of up to 12 percent and RMSE reductions of 30 to 60 percent for stock forecasts incorporating tweet sentiment.
The CFA Institute's October 2024 analysis sums it up: misinformation shocks generate transient but severe volatility spikes; algorithmic amplification of false content is a systemic risk.
5. Nuances, criticism, edge cases
5.1 Self‑fulfilling prophecy as a trap
The self‑fulfilling‑prophecy logic has an uncomfortable flip side: what fulfills itself can also destroy itself. Once enough market participants know the same support line, they place their stops there. Once the price pierces the line, the stops cascade — the "break" becomes the self‑fulfillment, the "hold" becomes the trap. Brock, Lakonishok, and LeBaron (1992) showed simple moving‑average rules to be profitable on DJIA data 1897–1986; Sullivan, Timmermann, and White (1999) showed that those same rules lost their performance out‑of‑sample after 1986 — presumably because too many traders discovered them.
5.2 Overconfidence — the chronic retail problem
Brad Barber and Terrance Odean have demonstrated in an impressive series that active retail investors systematically underperform. From 1991 to 1996, the most active 20 percent of 66,465 households earned a net 11.4 percent versus 17.9 percent for the market. Men trade 45 percent more than women and earn 1.4 percentage points less annually. A 2014 Taiwan study found that fewer than 1 percent of day traders predictably earn positive risk‑adjusted net returns.
In communities with live chart sessions where everyone "sees" what the pros do, overconfidence is especially contagious.
5.3 Algorithm updates as a disruption
Building a business model on an algorithm means building on sand. The X updates since 2023 — Premium boost, link penalty, Grok transition, "unregretted user seconds" — have repeatedly shifted the reach logic. An account that grew with aggressive bear takes in 2023 may be hit by sentiment throttling in 2026. Anyone who relied on external Substack links has been essentially invisible since March 2025 unless they are a Premium subscriber.
5.4 AI‑driven TA on the horizon
The most interesting edge case is AI‑driven technical analysis, moving into the mainstream via Grok‑style models. Platforms are experimenting with neural‑net pattern detection; The Long Investor itself has hinted in posts at using AI tools. If these models recognize the same patterns humans draw, the cascade effect accelerates further. If they find different patterns, a second layer of "market lines" emerges that only machines see — and that markets trace anyway, because automated orders respond to them in fractions of a second.
6. Regulation: what aims to slow the machine
6.1 The EU Digital Services Act
The DSA has been in force since November 2022. For Very Large Online Platforms — X included — obligations have applied since August 25, 2023; for smaller platforms since February 17, 2024.
Three articles matter directly for finance content. Article 27 requires all platforms to disclose the "main parameters" of their recommender systems. Article 38 mandates at least one non‑profiling recommender option for VLOPs — which is why X users have been able to toggle between "For You" and "Following" since 2024. Article 39 mandates a public ad repository. Articles 34/35 require systemic risk assessments — the lever regulators use to address algorithm risks.
In January 2026 the European Commission pursued proceedings against X around DSA transparency obligations; the interaction with the algorithm open‑sourcing strategy is still unresolved.
6.2 MiFID II and the ESMA warning to finfluencers
MiFID II has required marketing communications to be fair, clear, and not misleading since 2018. ESMA explicitly extended this to social‑media influencers in 2024. On February 6, 2024, it published a Warning for people posting investment recommendations on social media (ESMA74‑1103241886‑912) and extended MAR Article 20 requirements — objectivity, identity disclosure, conflicts of interest — to anyone posting investment‑recommendation content.
Legally, this is delicate. A chart post saying "I'm long $X, target 250" is an investment recommendation under the EU definition. Posting that without a disclaimer formally risks MAR violations.
6.3 BaFin: between warning and gap
BaFin issued its first public warning on social‑media investment tips in February 2022; in October 2024, it noted that 18‑ to 45‑year‑olds who follow finfluencers are four times more likely to buy crypto assets than average (48 % vs. 13 %). On January 9, 2026, the ESMA/BaFin Factsheet for Finfluencers appeared, with clear rules on responsibility, transparency, and an explicit clarification that "this is not investment advice" disclaimers provide no legal protection.
At the same time, BaFin's 2025 guidance decided that finfluencers are generally not classified as investment advisors, because they don't give individual recommendations. Professional associations such as BVK and AfW criticize this as a regulatory gap.
Documented fraud cases exist in abundance. In the Munich area, one investor lost €140,000 through a WhatsApp stock group; another lost €87,000 in weeks. Well‑known finfluencers such as Finanzfluss, Marc Friedrich, and Kolja Barghoorn have been systematically impersonated via deepfake since 2024/2026.
6.4 MiCA — the crypto gap closes
The EU Markets in Crypto‑Assets regulation (Reg. 2023/1114) has been fully applicable since December 30, 2024. Title VI establishes a market abuse regime for crypto assets, structurally modeled on MAR: insider trading, unlawful disclosure, market manipulation — explicitly including "dissemination of false or misleading signals via any medium, including social media."
A Doge pump tweet like 2021 would be potentially prosecutable in EU jurisdiction in 2026. Whether ESMA and national supervisors have the means to enforce that in practice is another question.
7. Practical implications for ambitious private investors
Once you understand the mechanics — chart as Schelling point, community as cascade amplifier, algorithm as speed multiplier — the question is no longer whether to participate. The question is how. A few observations I've taken from two years with communities and charts.
First: understand which cluster you sit in. Following three TA accounts on X puts you, within weeks, into a SimCluster that primarily shows you TA content — bullish or bearish, depending on your initial choice. This isn't neutral. The Cookson study is depressingly clear: echo chambers correlate with worse returns. Anyone serious about this curates their feed with friction — opposing voices, different methods, FA‑heavy accounts alongside TA‑heavy ones.
Second: read sentiment, don't follow it. The Fear & Greed Index isn't academically validated, but as a sentiment thermometer it's useful. Reducing positions at "Extreme Greed" and considering countercyclical buys at "Extreme Fear" is a simple heuristic against your own cascade susceptibility. It doesn't replace a strategy. It protects against the worst case of buying everything at the top.
Third: a small checklist for chart communities — whether The Long Investor, Wir Lieben Aktien, or a Telegram signal channel:
- Is the methodology falsifiable? Elliott Wave and similarly flexible frameworks are brilliant for narrative, hard to verify. Question: when does a count count as refuted?
- Is there an audited track record? Anonymous accounts without independently audited performance aren't a disqualifier, but a risk premium.
- Are the disclaimers honest or cosmetic? Since BaFin's January 2026 statement, "not financial advice" explicitly offers no legal protection.
- What's the ratio of free marketing to paid value? X as a funnel is legitimate; the price level decides — €33.50/month is a different proposition from €447.50.
- Is the community criticism‑tolerant? Servers where every counterpoint gets deleted are echo chambers by design.
Fourth: price algorithm risk into your strategy. When you see a setup widely shared on X, you know two things simultaneously: it will probably run short‑term (self‑fulfilling prophecy), and it will probably underperform long‑term compared to a quietly discovered setup (Park & Irwin; Barber & Odean). Ignoring that means buying reach, not edge.
Fifth, personal: What's become important to me in two years of observation is distinguishing inspiration from delegation. A community can be a great source of ideas. The moment it becomes the source of decisions, I'm no longer an investor, I'm a follower. And the algorithm sorting the posts for me is not my friend. It's a machine for maximizing seconds spent.
8. Outlook
If you extend the lines of 2026, everything points to two accelerations. First the regulatory one: DSA, MiCA, ESMA warnings, and the BaFin factsheet build a tighter net around finfluencers and platforms. The net won't make communities disappear — but it will make their disclaimers longer, their sponsorships more transparent, and their pump‑and‑dump susceptibility smaller.
Second the technical one: Grok‑based rankers and AI‑driven TA tools keep shifting the playing field. Community language likely becomes calmer because rage‑bait gets throttled. New cluster structures likely emerge because the machine sorts semantically, not just by engagement. And the asymmetry between Premium accounts with reach multipliers and free voices likely keeps widening as long as the platform monetizes it.
For German‑speaking investors, the sober observation remains that the most important movement of the past decade — the doubling of the shareholder count to 14.1 million — was not driven by chart communities, but by ETF‑savings‑plan education. The TA world is a fascinating field where one can learn a great deal about markets and even more about people. It is rarely the shortest path to wealth.
For those who still want to trade — a legitimate, intellectually demanding path — what matters isn't the volume of the algorithm but the discipline of one's own process. Charts are mirrors. Mirrors show a lot, but they don't show the door.
References
- Banerjee, A. V. (1992). A Simple Model of Herd Behavior. Quarterly Journal of Economics, 107(3), 797–817.
- Barber, B. M., & Odean, T. (2000). Trading Is Hazardous to Your Wealth. Journal of Finance, 55(2), 773–806.
- Barber, B. M., & Odean, T. (2001). Boys Will Be Boys. Quarterly Journal of Economics, 116(1), 261–292.
- Barber, B. M., Lee, Y.‑T., Liu, Y.‑J., & Odean, T. (2014). The Cross‑Section of Speculator Skill. JFQA, 49(2), 367–391.
- BaFin (2026). Factsheet for Finfluencers.
- Bikhchandani, S., Hirshleifer, D., & Welch, I. (1992). A Theory of Fads, Fashion, Custom, and Cultural Change as Informational Cascades. Journal of Political Economy, 100(5).
- Biallo (2026) — DAI shareholder figures 2026.
- Bloomberg (2024) — GameStop surges as Roaring Kitty return adds fuel to rally.
- Bollen, J., Mao, H., & Zeng, X. (2011). Twitter mood predicts the stock market. Journal of Computational Science, 2(1).
- Brock, W., Lakonishok, J., & LeBaron, B. (1992). Simple Technical Trading Rules and the Stochastic Properties of Stock Returns. Journal of Finance, 47(5).
- Brown, S. J., Goetzmann, W. N., & Kumar, A. (1998). The Dow Theory: William Peter Hamilton's Track Record Reconsidered. Journal of Finance, 53(4).
- CFA Institute (2024) — From Tweets to Trades.
- CNN Business — Fear & Greed Index.
- Cookson, J. A., Engelberg, J. E., & Mullins, W. (2023). Echo Chambers. Review of Financial Studies, 36(2).
- Da, Z., Engelberg, J., & Gao, P. (2015). The Sum of All FEARS. Review of Financial Studies, 28(1).
- Das Investment (2025) — BaFin guidance on finfluencers under criticism.
- Decrypt (2021) — Elon Musk's Dogecoin/Bitcoin Tweets Timeline.
- Edwards, R. D., & Magee, J. (1948/2018). Technical Analysis of Stock Trends (11th ed.). CRC Press.
- ESMA (2024). Warning for people posting investment recommendations on social media.
- European Commission — DSA: Very large online platforms and search engines.
- Fortune (2023) — Ryan Cohen under SEC investigation over BBBY trades.
- Gianstefani, I., Longo, L., & Riccaboni, M. (2022). The echo chamber effect resounds on financial markets.
- GitHub — twitter/the-algorithm.
- GitHub — xai‑org/x‑algorithm.
- Graphtreon — The Long Investor.
- Hamilton, W. P. (1922). The Stock Market Barometer. Harper & Brothers.
- Hu, D., Jones, C. M., Zhang, V., & Zhang, X. (2023). The Rise of Reddit: How Social Media Affects Retail Investors and Short‑Sellers' Roles in Price Discovery.
- Kindleberger, C. P., & Aliber, R. Z. (2015). Manias, Panics, and Crashes (7th ed.). Palgrave Macmillan.
- Lo, A. W. (2004). The Adaptive Markets Hypothesis. Journal of Portfolio Management, 30(5).
- Lo, A. W., Mamaysky, H., & Wang, J. (2000). Foundations of Technical Analysis. Journal of Finance, 55(4).
- Menkhoff, L. (2010). The Use of Technical Analysis by Fund Managers. Journal of Banking & Finance, 34(11).
- Park, C.‑H., & Irwin, S. H. (2007). What Do We Know About the Profitability of Technical Analysis? Journal of Economic Surveys, 21(4).
- Rhea, R. (1932). The Dow Theory. Barron's.
- SEC (2021) — Staff Report on Equity and Options Market Structure Conditions in Early 2021.
- Shiller, R. J. (2000). Irrational Exuberance. Princeton University Press.
- Social Media Today (2025) — X switching to fully AI‑powered Grok algorithm.
- Sullivan, R., Timmermann, A., & White, R. (1999). Data‑Snooping, Technical Trading Rule Performance, and the Bootstrap. Journal of Finance, 54(5).
- TechCrunch (2026) — X open sources its algorithm.
- The Long Investor — Patreon About.
- Twitter Engineering Blog (2023) — Twitter Recommendation Algorithm.
- Wikipedia — GameStop short squeeze.
Glossary
Adaptive Markets Hypothesis (AMH) — Andrew Lo's synthesis of EMH and behavioral finance. Cashtag — Stock or crypto symbol with a leading dollar sign ($AAPL, $BTC); algorithmic topic marker. Echo Chamber — Information environment where users mostly see content confirming their existing views. Elliott Wave — Method of interpreting price moves as five impulse plus three correction waves. FinTwit — Self‑label of the English‑language finance community on X. Heavy Ranker — ML model of the X algorithm that predicts engagement probabilities. Informational Cascade — Situation where actors ignore private information in favor of observed behavior. MAR (Market Abuse Regulation) — EU 596/2014; regulates insider trading and market manipulation; Art. 20 covers investment recommendations. MiCA — Markets in Crypto‑Assets Regulation; fully applicable since 30 Dec 2024. Schelling Point — Coordination point where expectations meet without explicit agreement. Self‑Fulfilling Prophecy — An expectation that brings itself about through the actions it induces. SimCluster — One of ~145,000 virtual communities in the X algorithm. Unregretted User Seconds — Dwell time minus actions interpreted as regretted (mute/block/report).
Last updated: May 16, 2026. Author: Dominik Weyh.